The short answer
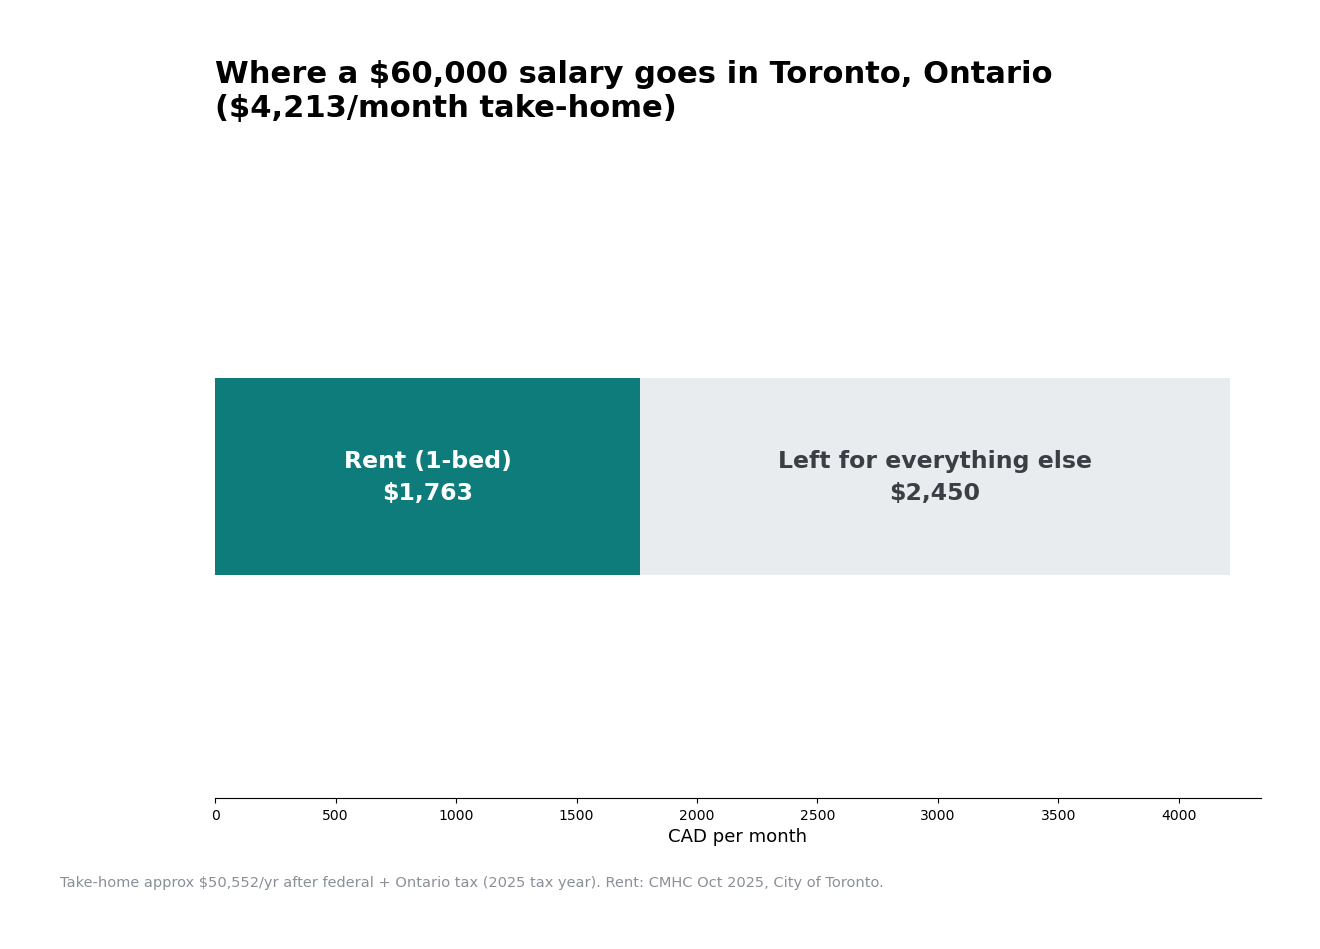
Yes — $60,000 works in Toronto, but only just. An average 1-bedroom rents for $1,763 a month, about 42% of your take-home pay, leaving roughly $2,450 a month for everything else. It’s workable for a single person with a careful budget; a 2-bedroom at $2,055 (49% of take-home) leaves almost no breathing room.
What $60,000 leaves you after tax in Ontario
- Gross: $60,000/year
- Estimated take-home: ~$50,552/year (~$4,213/month) after federal and Ontario income tax (2025 tax year)
- Note: estimate for a single filer with no dependents; actual take-home varies with RRSP contributions, benefits, and credits.
Rent in Toronto right now
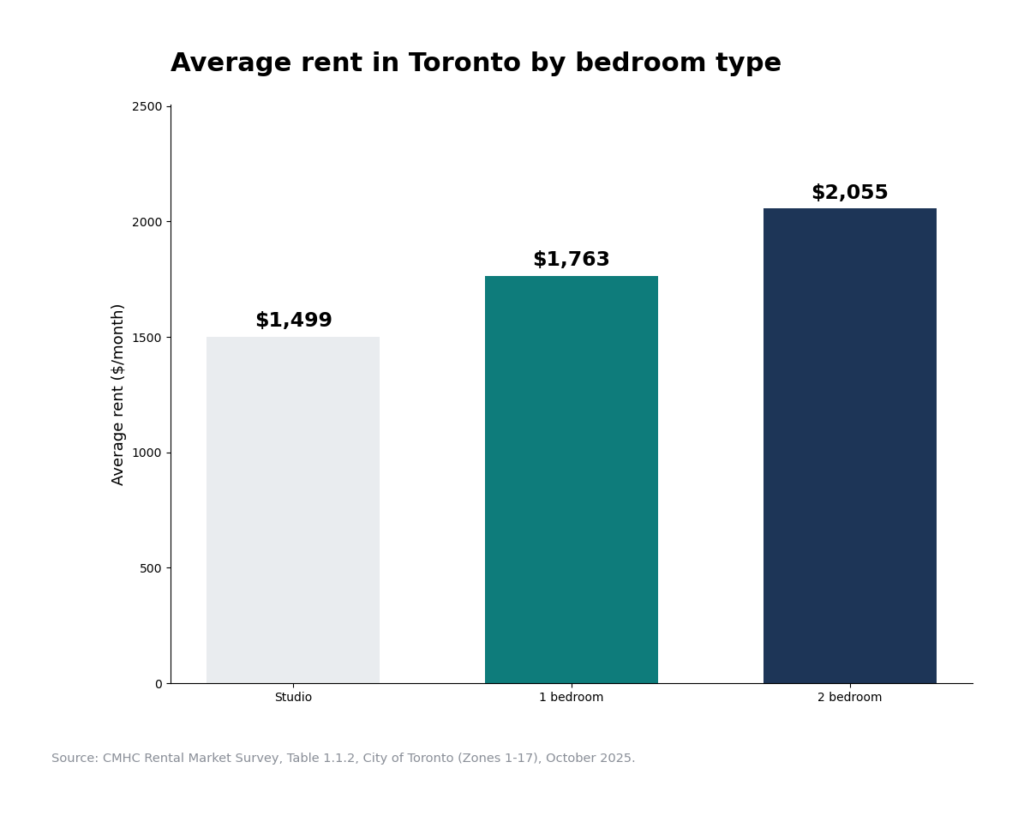
Average rents in the City of Toronto (CMHC, October 2025):
- Studio: $1,499/month
- 1 bedroom: $1,763/month
- 2 bedroom: $2,055/month
Toronto sits right between its neighbours: the 1-bedroom average is $15/month cheaper than Brampton’s $1,778 but $17/month more than Mississauga’s $1,746. A studio at $1,499 (about 36% of take-home) is the budget play here.
What people actually earn around here
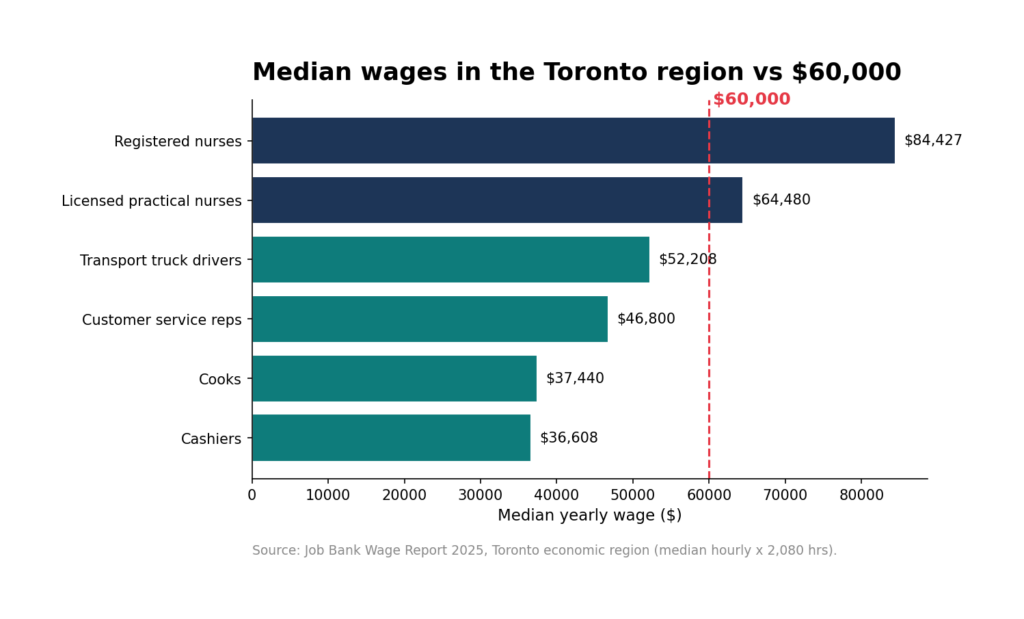
Median wages in the Toronto economic region (Job Bank, 2025 release), converted to yearly:
- Cashiers: ~$36,608/year
- Cooks: ~$37,440/year
- Customer service representatives: ~$46,800/year
- Transport truck drivers: ~$52,208/year
- Licensed practical nurses: ~$64,480/year
- Registered nurses: ~$84,427/year
At $60,000 you’re earning above the median for service, retail, and driving jobs in the region.
The monthly math
| $/month | |
|---|---|
| Take-home pay | $4,213 |
| Average 1-bed rent | $1,763 |
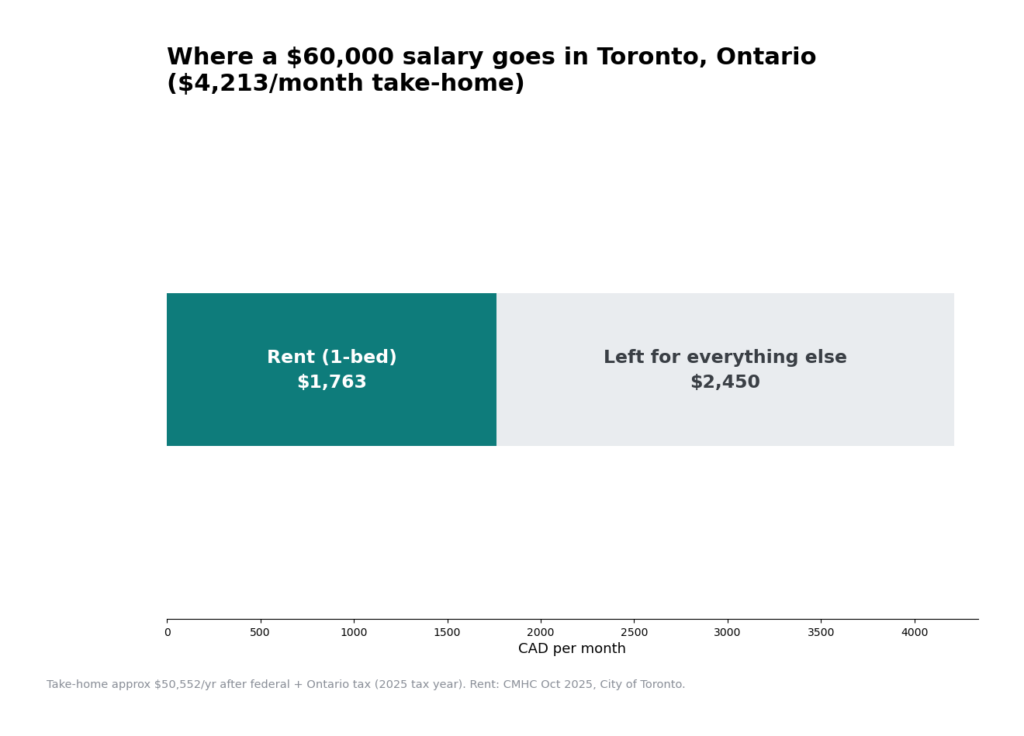
| Remaining for everything else | $2,450 |
Comparing the neighbours: Toronto’s average 1-bedroom is $1,763 vs Brampton’s $1,778 and Mississauga’s $1,746 — the three cities sit within $32 of each other. See our full Brampton $60,000 breakdown for the side-by-side.
What changed since last month
This is the first edition of this guide (October 2026 baseline). CMHC and Job Bank release annually, so these figures hold until the next releases — expected fall/winter 2026. We’ll update the comparison here when new data lands.
Where our data comes from
We publish our sources so you can check our math:
- Wages — Job Bank Wage Report, Employment and Social Development Canada (Open Government Licence – Canada). Figures are prevailing median wages by economic region, updated annually.
- Rents — CMHC Rental Market Survey, Canada Mortgage and Housing Corporation. Average rents by survey zone and bedroom type, published each December.
- Inflation — Statistics Canada Consumer Price Index, Table 18-10-0004-01, updated monthly.
Charts on this page are our own, drawn from the sources above. Figures were current as of October 2026; sources revise their data periodically.
Leave a Reply