The short answer
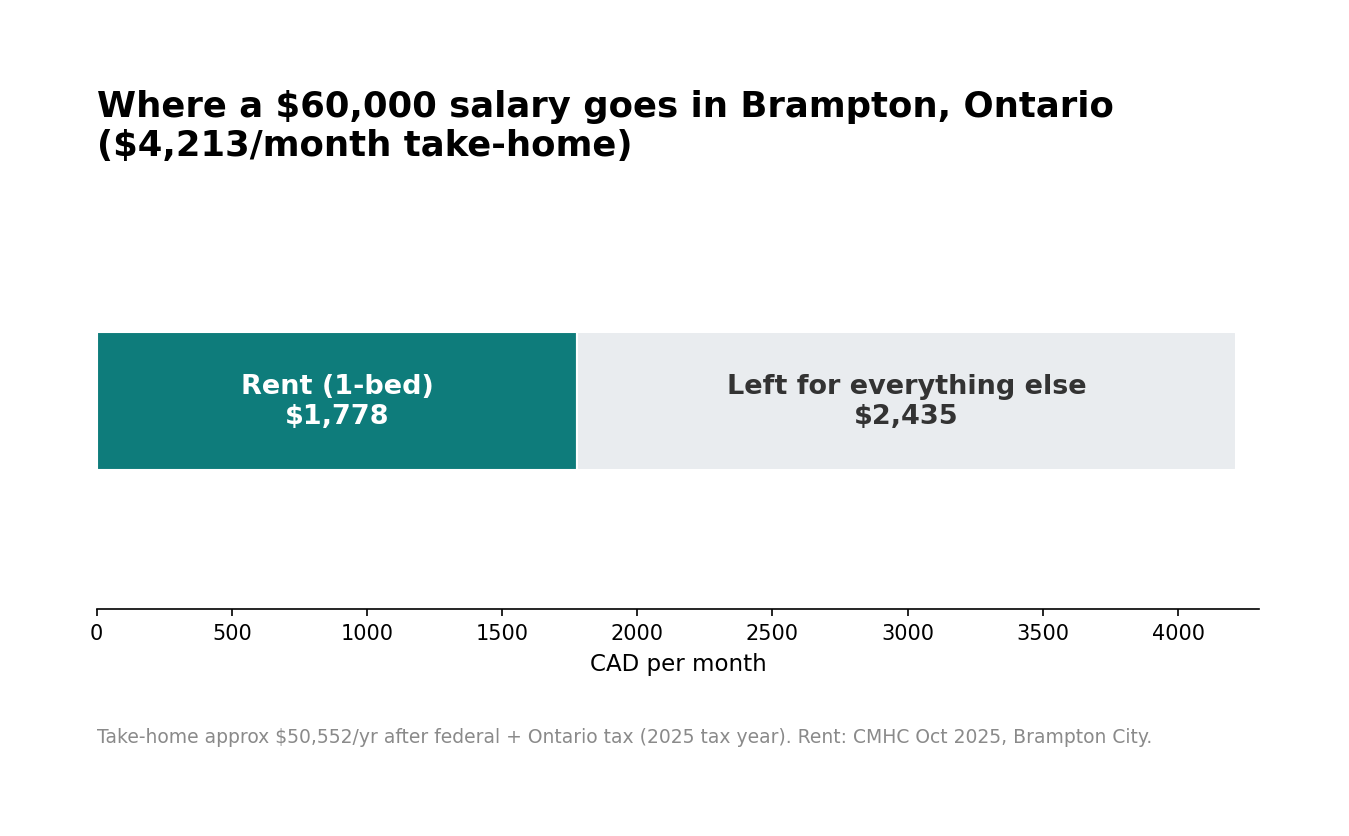
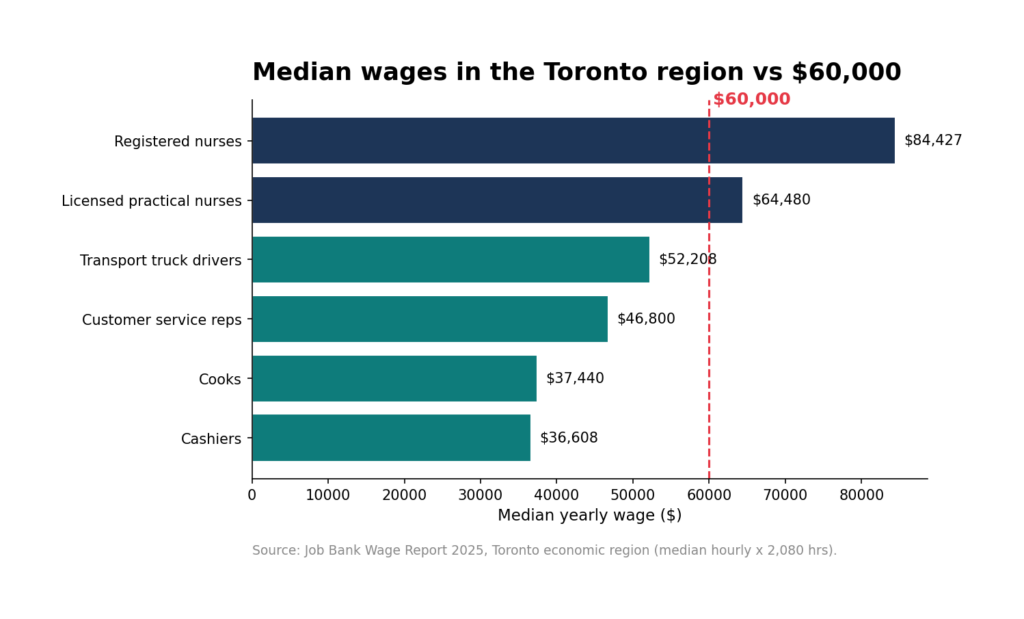
Yes — $60,000 is enough to live in Brampton, but housing will take a big bite. An average 1-bedroom rents for $1,778 a month, which is about 42% of your take-home pay. That leaves roughly $2,435 a month for everything else: food, transport, bills, and savings. It’s workable for a single person, tight for a family.
What $60,000 leaves you after tax in Ontario
- Gross: $60,000/year
- Estimated take-home: ~$50,552/year (~$4,213/month) after federal and Ontario income tax (2025 tax year)
- Note: estimate for a single filer with no dependents; actual take-home varies with RRSP contributions, benefits, and credits.
Rent in Brampton right now
Average asking rents in Brampton (CMHC, October 2025):
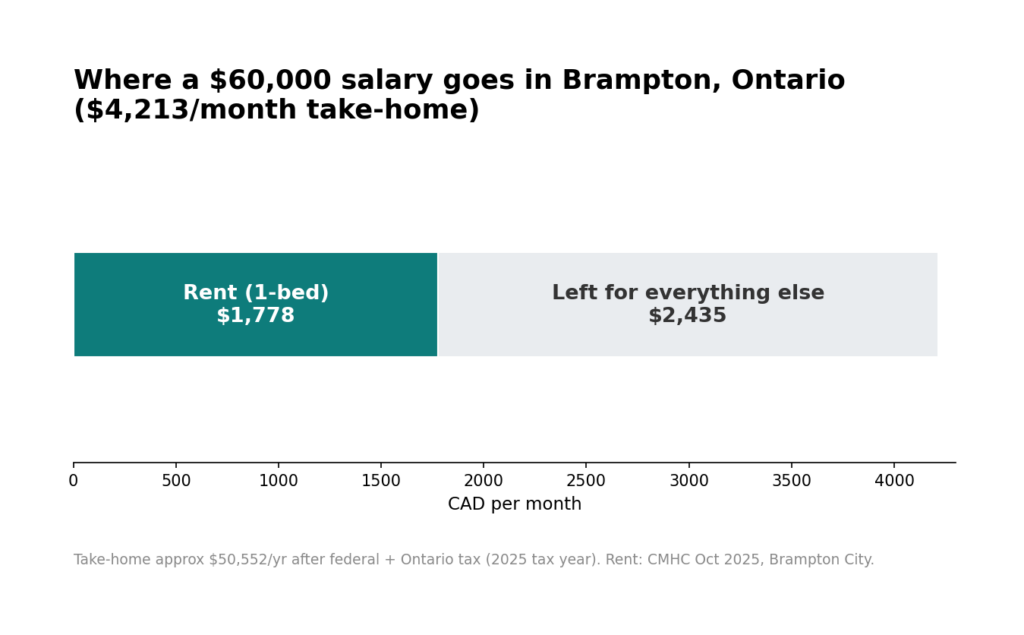
- Studio: $1,430/month
- 1 bedroom: $1,778/month
- 2 bedroom: $2,032/month
Brampton rents run noticeably below Toronto proper, which is the main reason the city works on a $60,000 salary. A 2-bedroom at $2,032 would take 48% of take-home — doable, but it leaves little breathing room.
What people actually earn around here
Median wages in the Toronto economic region (Job Bank, 2025 release), converted to yearly:
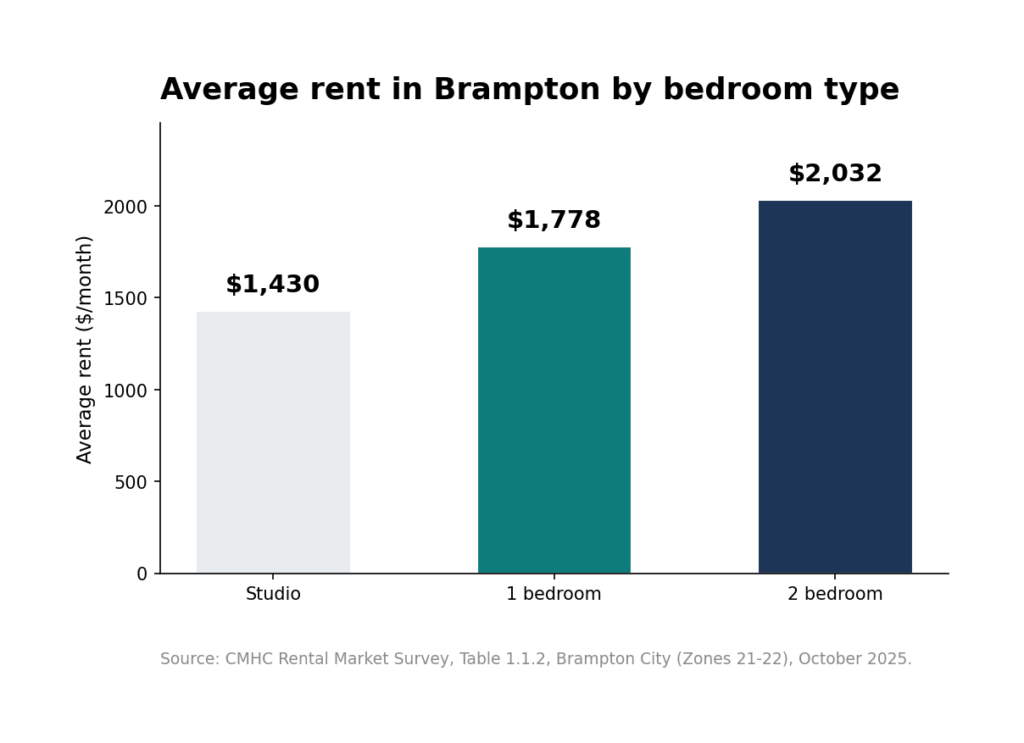
- Cashiers: ~$36,608/year
- Cooks: ~$37,440/year
- Customer service representatives: ~$46,800/year
- Transport truck drivers: ~$52,208/year
- Licensed practical nurses: ~$64,480/year
- Registered nurses: ~$84,427/year
At $60,000 you’re earning above the median for service, retail, and driving jobs in the region — roughly in line with skilled trades and practical nursing.
The monthly math
| $/month | |
|---|---|
| Take-home pay | $4,213 |
| Average 1-bed rent | $1,778 |
| Remaining for everything else | $2,435 |
Financial advisors often suggest keeping housing under 30–35% of gross income. At 42% of take-home on a 1-bedroom, you’re above that guideline — the classic Brampton trade-off: cheaper than Toronto, but still a stretch on a single $60k income. A studio at $1,430 (34% of take-home) fits the guideline comfortably.
What changed since last month
This is the first edition of this guide (October 2026 baseline). CMHC and Job Bank release annually, so these figures hold until the next releases — expected fall/winter 2026. We’ll update the comparison here when new data lands.
Where our data comes from
We publish our sources so you can check our math:
- Wages — Job Bank Wage Report, Employment and Social Development Canada (Open Government Licence – Canada). Figures are prevailing median wages by economic region, updated annually.
- Rents — CMHC Rental Market Survey, Canada Mortgage and Housing Corporation. Average rents by survey zone and bedroom type, published each December.
- Inflation — Statistics Canada Consumer Price Index, Table 18-10-0004-01, updated monthly.
Charts on this page are our own, drawn from the sources above. Figures were current as of October 2026; sources revise their data periodically.